There is an easy way to claim that a quiz has been tested: play it a few times, make sure every button works, and stop when the results feel plausible. We wanted a harder answer. BuzzGoing currently publishes 38 quizzes with between four and seven questions. Every question has four options. That makes the complete space large enough to be interesting but small enough to inspect in full.
So we enumerated it. On 24 September 2026 we ran every possible answer combination through the same scoring rules used by the public site: 213,248 complete quiz attempts covering 210 questions and 170 configured outcomes. This was a structural test, not a user study. No visitor answers, cookies, identities or analytics were collected. The complete CSV, JSON and reproduction script are published with this article.
The question we actually asked
We did not ask whether real people receive each result equally often. Real choices are not random: plenty of people would pick coffee over tea, safety over speed, or a familiar flag over an obscure one. Without observed responses, pretending to predict that behaviour would only replace missing data with an assumption.
We asked a narrower and answerable question. If each of the four options at every step is treated as equally possible, what proportion of all mathematical paths reaches each outcome? That exposes unreachable results, score bands that swallow most combinations, and tie rules that quietly favour one label. It is a test of the mechanism rather than of the audience.
For a four-question quiz there are 4⁴, or 256, complete paths. Five questions produce 1,024, six produce 4,096 and seven produce 16,384. We enumerated all of them rather than drawing a random sample, so there is no sampling error in the figures. Anyone running the published script against the same version of the site should get the same output.
First result: all 170 outcomes can actually happen
The most basic failure would be an outcome that no possible set of answers can reach. There were none. All 170 configured results received at least one path. That sounds like a low bar, and it is, but it is exactly the kind of error that appears when questions are shortened, result keys are renamed or a page is copied and edited. The audit now runs from source data, which means the same test can be repeated after future changes.
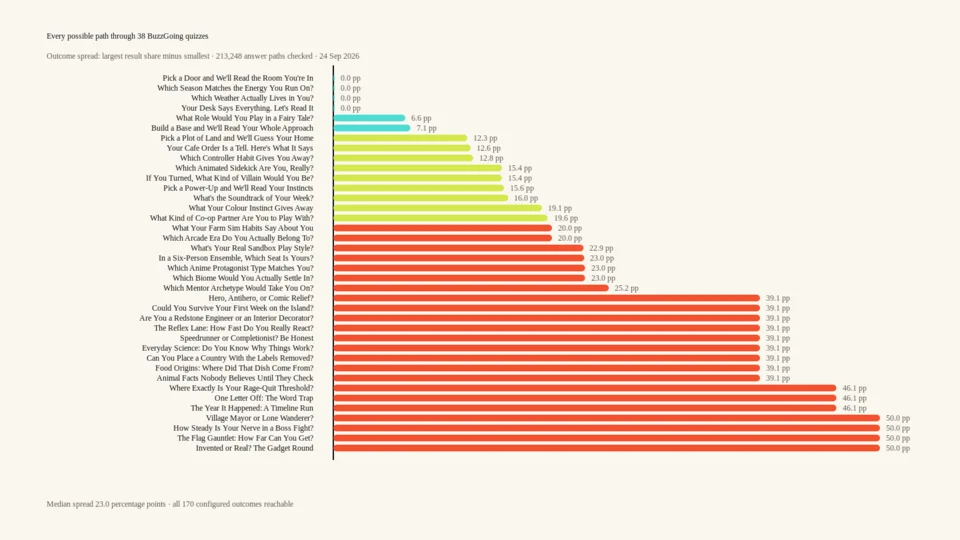
Reachable does not mean equally likely under the test. Across all 38 quizzes, the median gap between the largest and smallest structural result share was 23.01 percentage points. Six quizzes had a spread of ten points or less; 23 had a spread above twenty points. Those two numbers initially looked alarming until we separated the two scoring systems.
Typed quizzes and scored quizzes behave differently
Twenty-two quizzes use typed outcomes. Each answer adds one vote to a named result such as Seeker, Helper or Dispatcher, and the largest tally wins. Across 142,336 complete typed-quiz paths, the median largest-to-smallest spread was 15.53 percentage points. Four quizzes landed on a mathematically perfect 25 per cent for each of four outcomes: Pick a Door, Your Season of Energy, Which Weather Lives in You and Your Desk Says Everything.
The uneven typed cases mostly come from ties. The public logic resolves a tied tally using the first result type encountered in the selected answers. That rule is deterministic and easy to explain, but it is not neutral. A result that tends to occur earlier in the question sequence receives more tied paths than an otherwise identical result that appears later. The effect is especially visible in four-question quizzes with five possible outcomes, because ties and unused result types are common.
Sixteen quizzes use a numerical score. Every question contributes zero, one, two or three points, and the total falls into one of four contiguous bands. These produced 70,912 complete paths and a median spread of 39.06 percentage points. The reason is combinatorial rather than editorial. There are many ways to make a middle score and very few ways to make an extreme one. With six questions there is only one all-zero route and one all-three route, while thousands of mixtures gather near the centre.
Why an uneven score is not automatically a broken score
If the result labels describe a spectrum, making the extreme outcomes rare can be intentional. A quiz called Village Mayor or Lone Wanderer should probably send mixed answers toward its middle labels and reserve the endpoints for consistently social or consistently solitary choices. Equal-width score bands do that naturally. Forcing each outcome to own exactly one quarter of the mathematical paths would require narrow middle bands and very wide extremes, which would make a nearly neutral answer pattern look unusually decisive.
That does not give the current system a free pass. It changes the review question. For typed quizzes, the first-seen tie rule deserves scrutiny because order is unrelated to meaning. For scored quizzes, the key check is whether the result copy acknowledges that an endpoint represents consistent answers rather than a population percentile. The site now publishes the distribution so an editor can see the consequence before changing a threshold or cutting a question.
The largest and smallest spreads
Pick a Door produced the smallest possible spread: zero. Its four results each received exactly 256 of 1,024 paths. Several other four-result typed quizzes matched that pattern at longer lengths. At the other end, six-question scored quizzes including Village Mayor or Lone Wanderer, How Steady Is Your Nerve in a Boss Fight, the Flag Gauntlet and Invented or Real Gadget showed a 50.05-point gap between their largest and smallest result shares.
That repeated number is useful evidence. It tells us the spread is a property of the common six-question score-band design, not a mysterious feature of four unrelated topics. Seven-question scored quizzes had a slightly smaller but still substantial 46.06-point spread. Four- and five-question scored quizzes each produced their own repeated signature. A template has left a measurable fingerprint, which is precisely the kind of thing this audit was meant to reveal.
What we changed, and what we did not
We added a build-time requirement that every public quiz use four to seven questions, that every typed result be reachable, and that every scored question contain the four point values exactly once. The exhaustive study sits beside those faster checks: it is slower, but it gives editors an outcome map rather than a yes-or-no validation.
We have not rewritten every score band to chase equal quarters. That would optimise the number in this report while making several quizzes less coherent. We also have not described 213,248 paths as 213,248 players. They are combinations generated by code, not people. The dataset contains no evidence about what visitors prefer, how they understand a question or whether a result feels accurate.
The next useful study would require willing participants and a disclosed protocol: ask people to retake selected quizzes after a delay, measure result stability, collect optional feedback on ambiguous items and publish the sample size with the misses as well as the successes. Until that exists, this audit remains what it says it is: a complete map of the machinery.
How to reproduce it
Download the script and run it from the BuzzGoing source tree with Python. It imports the same paced quiz data used by the site, enumerates the Cartesian product of each question's options, applies the public score bands or typed-result rule, and writes one row per quiz plus a detailed JSON file containing every outcome count. The script also creates the chart above.
The useful part of publishing code is not that everybody will run it. It is that the figures stop depending on our authority. The path count, the tie behaviour and every percentage can be challenged from the same materials that produced them. For a small entertainment site, that is a more honest form of original research than attaching an impressive-looking survey number to a sample nobody can inspect.